
Mathedu Courses
Mathedu Courses
If you see this, something is wrong
First published on Saturday, Aug 22, 2026 and last modified on Tuesday, Sep 1, 2026
Attend the course ’Scientific Computions with Python - The Basics’ before that lecture.
Get an Editable Window for a Figure in Python
Watch the video by preference
We shall first parameterize Spyder in the preferences in IPython console.
Graphics> Backend> Automatic instead of Inline, so we shall have a separate window.
We quit Spyder and we relaunch it so that the parameterization is taken into account.
File new file to write a new script.
We save it to give it a name and to put it in the right directory.
We call our script StraightLinesDrawing.py From numpy we import everything to have the function arange.
from matplotlib.pyplot, to be able to draw functions, we import everything, star.
from numpy import *
from matplotlib.pyplot import *And now we define the functions we want to plot.
The variable x is arange, starting from -10 up to 11 excluded, by steps of 0.1.
We have a vector y0 is equal to 0 multiplied by x, so that we have zeros with a vector of the length of x.
y1 is equal to x.
y2 is equal to -x the opposite of x.
y3 is equal to 2/3 multiplied by x minus 4/5.
And y4 is equal to minus 2/3 multiplied by x plus 4/5.
#definition of functions
x=arange(-10,11,0.1)
y0=0*x
y1=x
y2=-x
y3=(2/3)*x-(4/5)
y4=-(2/3)*x+(4/5)And now we draw straight lines.
plot x and y0, with the label for the legend y equals 0.
We plot x, y1, with the label y equals x.
We plot x, y2, with the label y equals -x.
We plot x, y3, with the label y equals 2/3 multiplied by x plus 4/5.
We plot x, y4, with the label… oops we missed a parenthesis, an opening parenthesis… minus 2/3 multiplied by x plus 4/5.
And we plot y0 x with the label x equals 0 because y0 is equal to 0.
#Draw Straight Lines
plot(x,y0,label='y=0')
plot(x,y1,label='y=x')
plot(x,y2,label='y=-x')
plot(x,y3,label='y=(2/3)*x-(4/5)')
plot(x,y4,label='y=-(2/3)*x+(4/5)')
plot(y0,x,label='x=0')
legend()We legend with the labels.
x lim -15, 15 so that the scale of x is between -15 and 15.
The same for the scale of y.
We add a grid.
The title Straight Lines.
xlim(-15,15)
ylim(-15,15)
grid()
title('Straight Lines')We save and we run.
So we have a figure in a separate window as we have parameterized Spyder.
And we may save the figure in the right directory and we give it a name StraightLines.png.
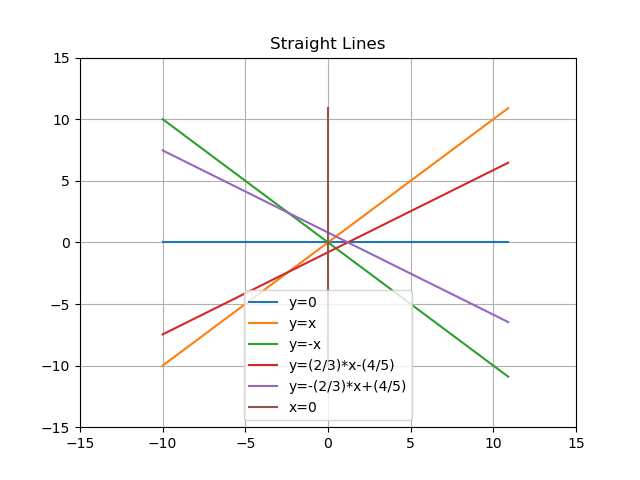
Straight Lines